
Vega
3D Land Survey Design and Analysis. Developed for ECL – Exploration Consultants Limited. Now owned by RPS.
Vega Features Vega contains many of the functions and utilities required for the QA/QC of SPS positioning data.
It also includes manipulation, editing and production of new SPS data file sets.
The system includes the following features:
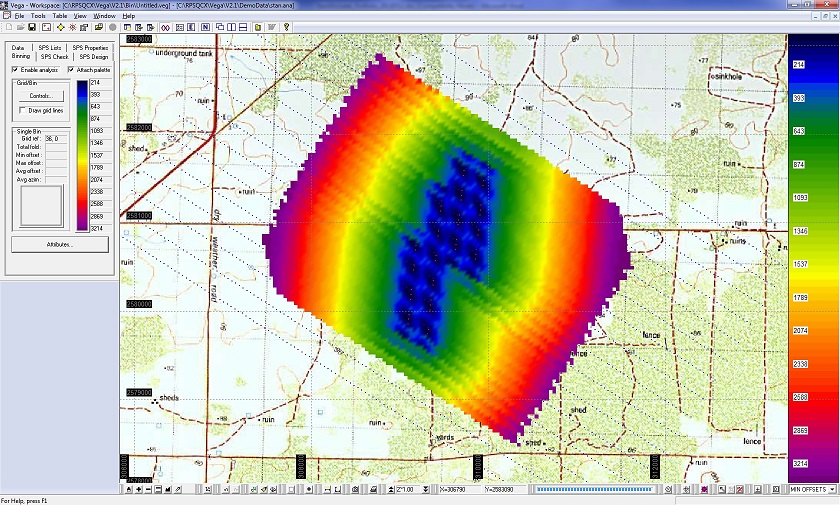
• Single or multiple SPS data file importing, with source and receiver location display on a georeferenced (X,Y) background.
• Display manipulation, including Pan, Zoom, Rotation, Grid Lines and Background Color etc.
• Point-and-click measurement of distances and angles between displayed points.
• Display Window image capture from selectable region with saving to image file or Windows Clipboard.
• Formatted printing of Display Window to any Windows printer, including Acrobat PDF Writer (if installed).
• SPS point-and-click interrogation of Source and Receiver properties on-screen.
• SPS data relationship checking, either graphically or from scrollable source and receiver point lists.
• Selection Tool for point-and-click source or receiver moving or deletion.
• Enclosure Tool for multiple point selection for source and receiver point moving or deletion.
• Writing of new SPS data file sets once points have been edited, including updated Relationship Files.
• Import, register and display of single or multiple graphic image files, such as topographic maps and satellite images
for underlaying on SPS point position data displays.
• Image layer manipulation to change image display stacking order.
• Binning calculation and displays, including
• Fold displays, either color palette coded or numeric values in each bin. Midpoint Scatter display,
showing CMP locations for every valid source/receiver pair. Offset Range display, either color-coded or bar graph,
showing CMP offset distribution for every valid source/receiver pair.
Azimuth display, either color-coded Average Azimuth or “Spider Plot” displays of CMP azimuth distribution
for every valid source/receiver pair. Offset and Azimuth spider plots, showing azimuth and relative offset for
every valid source/receiver pair.
• Single Bin mode for query and display of attribute analyses for a single bin as the mouse cursor is moved over
the main bin grid analysis display.
• All binning CMP coordinate, offset and azimuth data saved to proprietary binary database files for speed of access.
• SPS format compliance checking, including automatic detailed report generation to>
Rich Text Format (RTF) files for use in report generation.
• 3D display capabilities of Binning computations, including full surface rendered modeling of fold contribution,
point elevations, etc.
• Analysis "calculator" provides the means to produce new bin content analysis files by perfomring arithmetic
calculations on two separate analysis files, such as subtraction, addition, average, min and max.
• Exporting of a single bin analysis attribute for all bin grid cells to text files for quantitative analyses
of computed or result analysis files.
• Integrated scanning of maps and charts into the image registration utility using any Twain compliant scanner.